Detecting and preventing retain cycles is crucial, as they lead to memory leaks, degrade app performance, and cause unexpected behaviors. Many developers, especially those new to Swift and UIKit, struggle with understanding strong reference cycles in closures, delegates, and class relationships.
We will present two classic retain cycle bugs in a sample iOS app, explore the tools that Xcode provides for detecting them, and share some advice on how to avoid them.
Memory Graph Debuger
The sample application consists of two view screens. The pushed screen contains injected retain cycles, leading to memory leaks. A memory leak occurs when memory references cannot be deallocated. In this app, the leak happens when the pushed screen is popped back but remains in memory.
Build and deploy app on simulator (or real device):
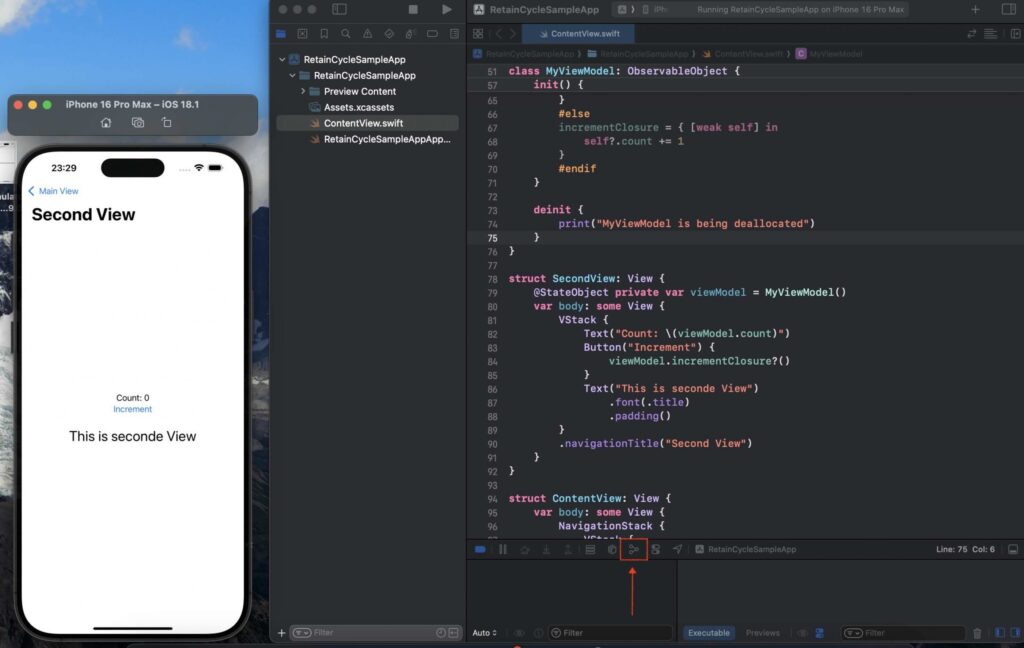
Open Memory Graph Debuger
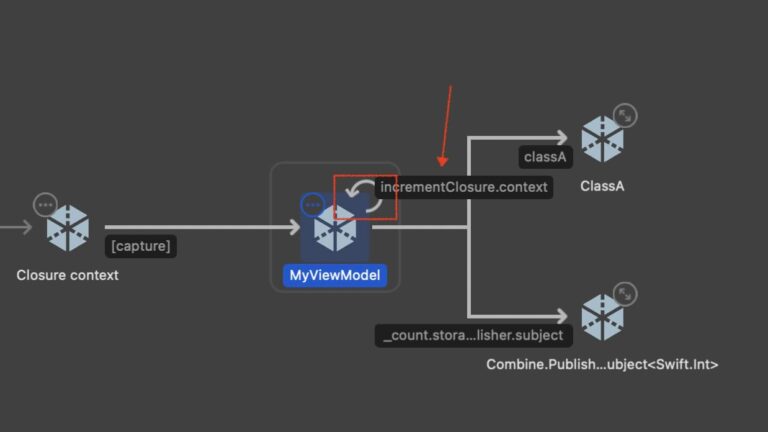
In this case is clear where do we have a retain cycle.
class MyViewModel: ObservableObject {
    @Published var count: Int = 0
    var classA: ClassA  = ClassA()

    var incrementClosure: (() -> Void)?

    init() {
...

        #if true
        incrementClosure = {
            self.count += 1
        }
        #else
...
        }
        #endif
    }

    deinit {
        print("MyViewModel is being deallocated")
    }
}

struct SecondView: View {
    @StateObject private var viewModel = MyViewModel()
    var body: some View {
In SecondView, MyViewModel is referenced using viewModel, MyViewModel.incrementalClosure, and self, which also references MyViewModel indirectly. When the view is popped, this class cannot be removed from memory because it is retained due to an internal reference from self.count.
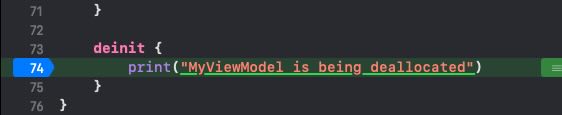
If you set a breakpoint in the deinit method, you will notice that it is never triggered. This indicates that the class is still retained, leading to a memory leak. As a result, the memory allocated for MyViewModel will never be deallocated or reused, reducing the available memory for the app. When the app runs out of memory, iOS will forcefully terminate it.
The only way to break this retain cycle is to make one of these references weak. Using a weak reference ensures that it is not counted toward the retain count. When the view is popped, SecondView holds the only strong reference, allowing iOS to deallocate MyViewModel and free up memory.
This is the correct solution:
class MyViewModel: ObservableObject {
    @Published var count: Int = 0
    var classA: ClassA  = ClassA()

    var incrementClosure: (() -> Void)?

    init() {
        ...

        #if false
      ....
        #else
        incrementClosure = { [weak self] in
            self?.count += 1
        }
        #endif
    }

    deinit {
        print("MyViewModel is being deallocated")
    }
}
Set a breakpoint in deinit to verify that the debugger stops when the view is popped. This confirms that the class has been properly deallocated
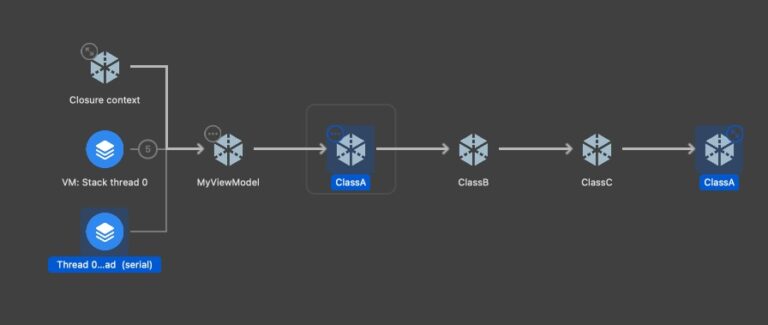
Next retain cycle is a memory reference cycle, when we have a chain of refenced classes and once of them is referencing back it generates a loop of references. For implementing this memory leak we have created a classA that references a classB that references a classC that finally refences back to classA.
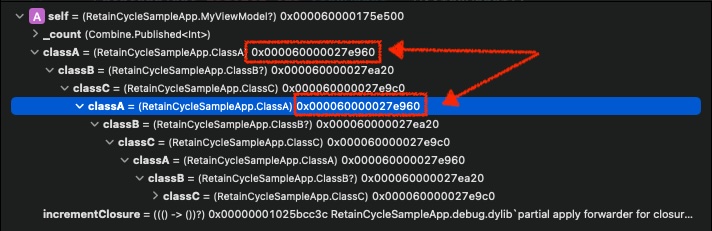
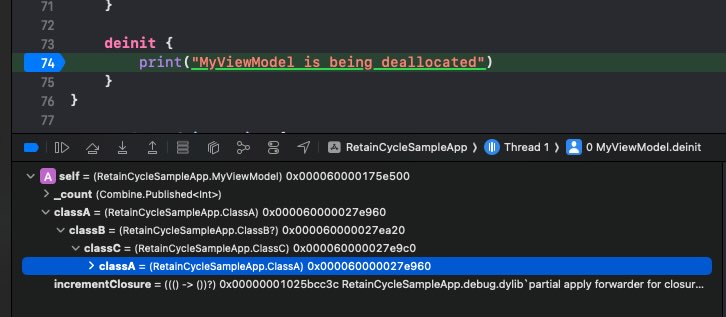
Here we can see clear that same memory address is referenced. But if we take a look at Debug Memory Inspector
It is not as clear as the previous case. This is a prepared sample app, but in a real-world application, the graph could become messy and make detecting memory leaks very difficult. Worst of all, with this kind of memory leak, when the view is removed, the deinit method is still being executed.
For detecting such situations we will have to deal with another tool.
Insruments
Xcode Instruments is a powerful performance analysis and debugging tool provided by Apple for developers to profile and optimize their iOS, macOS, watchOS, and tvOS applications. It offers a suite of tools that allow developers to track memory usage, CPU performance, disk activity, network usage, and other system metrics in real-time. Instruments work by collecting data through time-based or event-based profiling, helping identify performance bottlenecks, memory leaks, and excessive resource consumption. Integrated within Xcode, it provides visual timelines, graphs, and detailed reports, making it an essential tool for fine-tuning app efficiency and responsiveness.
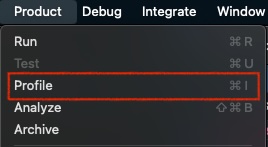
In XCode Product menu select Profile:
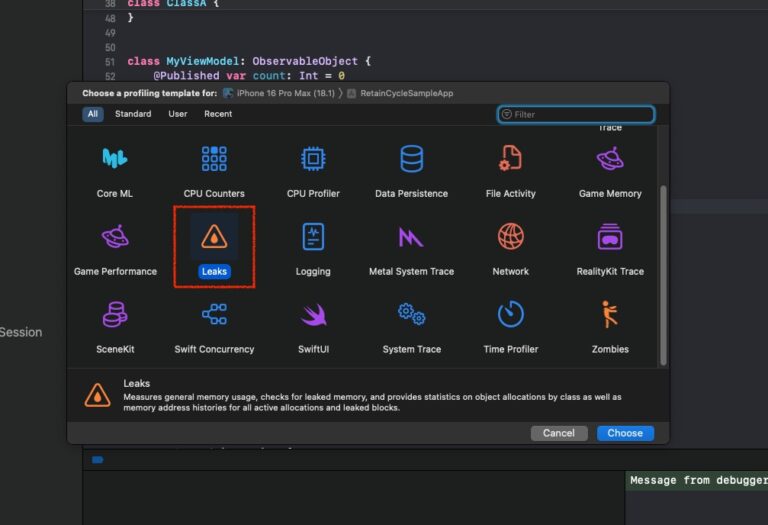
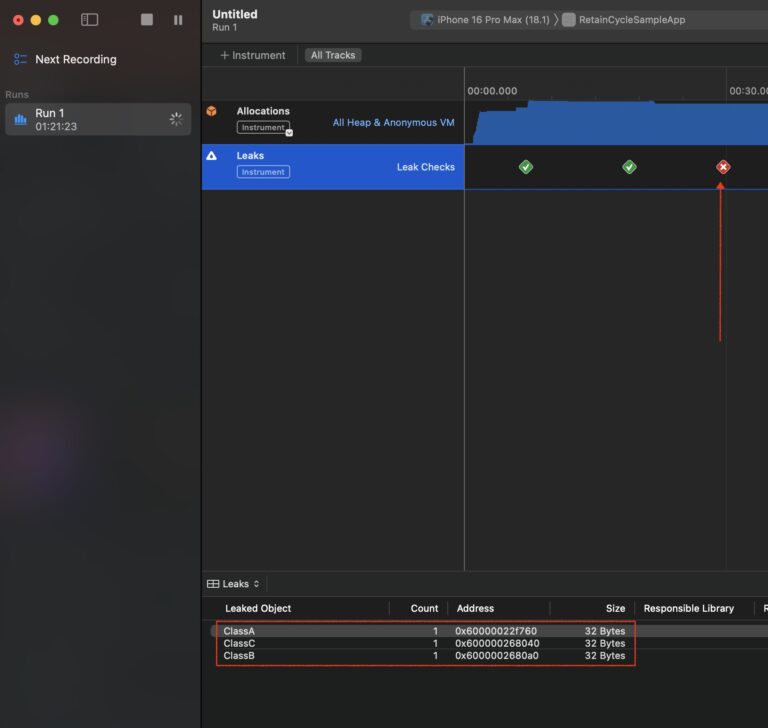
For measuring memory leaks select ‘Leaks”:
Press record button for deploying on simulator and start recording traces.

In following video, you will see that when view is pushed back then memory leak is detected:
Is programed to check memory every 10 seconds, when we click on red cross mark then bottom area shows the classes affected:
Conclusions
In this post, I have demonstrated how to detect memory leaks using the Memory Graph Debugger and Inspector. However, in my opinion, preventing memory leaks through good coding practices is even more important than detecting them.
In Swift, memory leaks typically occur due to retain cycles, especially when using closures and strong references. To avoid memory leaks, you can use weak references where appropriate.
You can find source code used for writing this post in following repository.
References
- Detect and debug memory issues
WWDC 2021